
如果觉得复习gre数学考试比较难,那么不妨从这些题目练习开始,每篇都是按照分类给大家列举了一些典型题目,本篇主要是针对gre数学考试数据解释题型方面的典型题目及答案。每天2道题,希望对大家的复习有所帮助。
获得更多留学知识 请咨询无忧免费在线顾问
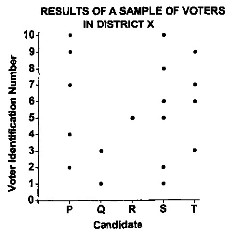
The graph above shows how a sample of 10 different voters (vertical axis) voted for 5 different candidates (horizontal axis). Each voter voted for either one or two of the five candidates(No voter voted twice for the same candidate).The two candidates receiving the most votes were the winners. The sample constituted 5 percent of those in the district who voted, and the number of votes in the district for each candidate was in the same proportion as the number of votes in the sample for each candidate.